
A Global Transportation Network
Every second, 347 people around the world step into an Uber. In the time it takes to read this sentence, roughly 2,000 rides have begun — a commuter in Chicago heading to the office, a tourist in Bangkok navigating unfamiliar streets, a student in Lagos getting home after class. Uber's 30 million daily trips make it the largest transportation company on Earth by trip volume, operating in over 10,000 cities across 70+ countries.
This figure includes both traditional ride-hailing (UberX, Comfort, Black) and Uber Eats delivery trips. Ride-hailing accounts for approximately 60% of daily trips, while food and grocery delivery makes up the remaining 40% — a split that has shifted significantly since the pandemic accelerated delivery adoption.
The Algorithm Behind Matching
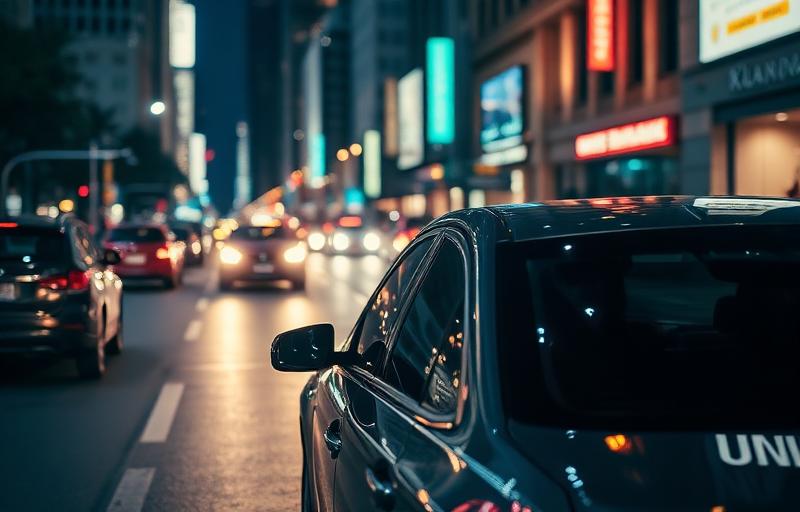
When a rider opens the Uber app and requests a trip, the platform's matching algorithm evaluates dozens of variables within milliseconds: driver proximity, traffic conditions, driver ratings, vehicle type preferences, surge pricing zones, and predicted trip routes. The system must balance rider wait times (average 3–5 minutes in urban areas) against driver utilization and platform efficiency.
At 30 million trips per day, the matching engine processes roughly 150 million driver-rider evaluation pairs daily — a computational challenge that requires massive distributed computing infrastructure. Uber's engineering team has described the system as one of the most complex real-time optimization problems in industry, comparable in complexity to air traffic control but operating at 300x the scale.
Economic Impact and the Gig Economy
Uber's 7.1 million active drivers represent one of the largest flexible labor forces in history. For many, driving is a primary income source; for others, it supplements traditional employment. The platform generates an estimated $100–120 million in daily driver earnings globally, with average hourly earnings varying dramatically — from $25–30/hour in New York and London to $5–8/hour in parts of South Asia and Latin America.
The ride-hailing industry has fundamentally changed urban transportation economics. In cities where Uber operates extensively, taxi medallion values have plummeted (New York medallions fell from $1.3 million in 2014 to under $200,000), public transit ridership patterns have shifted, and car ownership rates among young urban professionals have declined. Researchers debate whether ride-hailing reduces or increases overall traffic congestion — evidence suggests it reduces drunk driving and parking demand but may increase total vehicle-miles traveled.
The Busiest and Quietest Hours
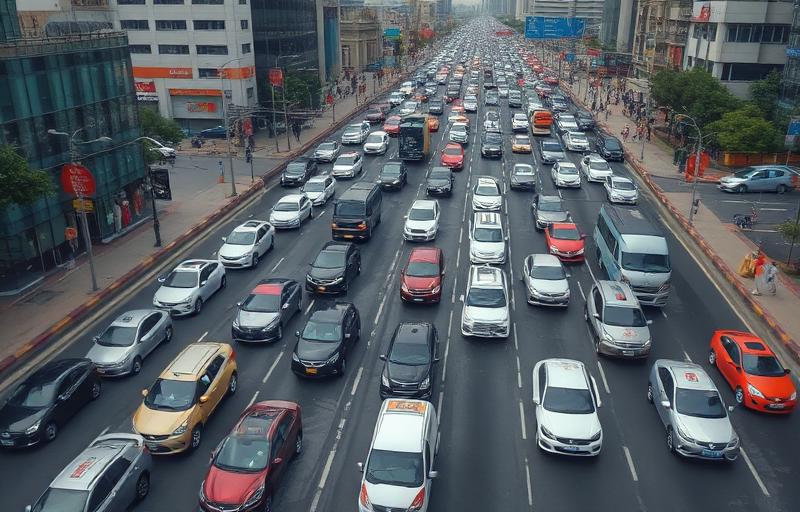
Uber's daily volume follows distinct patterns. Morning commute hours (7–9 AM local time) and evening hours (5–8 PM and 10 PM–2 AM on weekends) see the highest demand. Friday and Saturday nights typically generate 40–50% more rides than Monday through Wednesday. New Year's Eve is consistently the single busiest day of the year, with volumes exceeding 50 million trips globally.
Weather plays a surprisingly large role: rainy days see ride requests spike 30–40% in affected cities, while extreme heat or cold similarly drives demand. Major events — concerts, sports games, conferences — create localized surges that the platform manages through dynamic pricing, which simultaneously increases driver supply and moderates excess demand.
30 Million Rides in Perspective
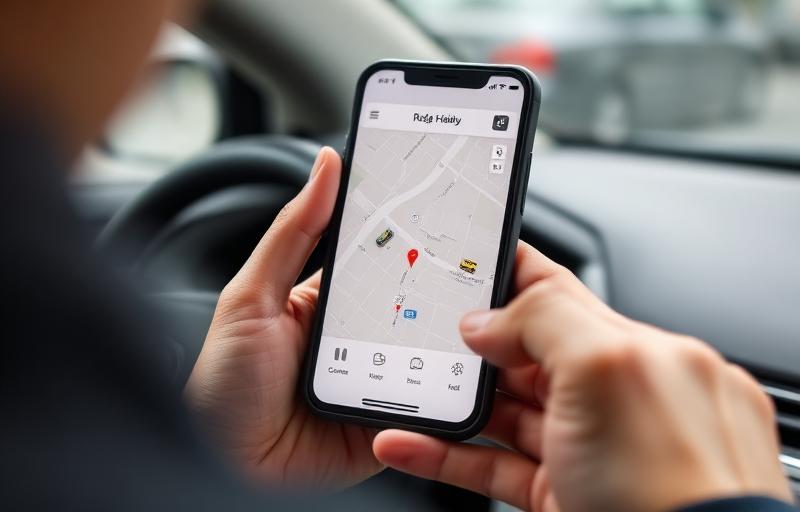
If all 30 million daily Uber rides happened simultaneously, they would fill a highway stretching approximately 150,000 kilometers — nearly four times around the Earth's equator. The combined distance covered by Uber rides each day — roughly 255 million kilometers — is equivalent to 1.7 trips from Earth to the Sun. In terms of passenger-hours, today's rides represent about 9 million hours of combined travel time — a millennium of continuous driving compressed into 24 hours.
More data: Flights per day · Card transactions per day · Amazon orders per day