
Quick facts
- ▸~1.6 million Amazon orders are placed every day in 2026 — about 18.5 every second.
- ▸~2.5 million packages ship daily — orders often split across multiple fulfilment centres.
- ▸220M+ Prime members drive 25–30 orders/yr each vs. 10–15 for non-Prime.
- ▸Amazon holds 37–40% of US ecommerce; 13–15% globally.
- ▸Prime Day generates ~5× normal volume; Black Friday peaks at 10M+ orders/day.
While you've been on this page…
Live, since you opened the page — at typical worldwide rates.
+14
Amazon orders placed · ~18.5 / sec
+11,078
Credit card transactions · ~14K / sec
+2,769,550
Emails sent · ~3.5M / sec
Amazon in perspective
Amazon / day
~1.6M orders
Daily average
Prime Day
~7.8M orders
Per day, 48hr window
Prime Day generates ~5× the order volume of a normal day.
US ecommerce
~40%
Amazon's share
Global ecommerce
~14%
Amazon's share
Outside the US, Alibaba, JD.com, Mercado Libre and Flipkart dominate.
Fulfilment centres
~1,500
Worldwide
Delivery drivers
~400K
Amazon Logistics
Amazon now delivers 72% of its own US packages — up from 50% in 2022.
The Ecommerce Giant's Daily Machine
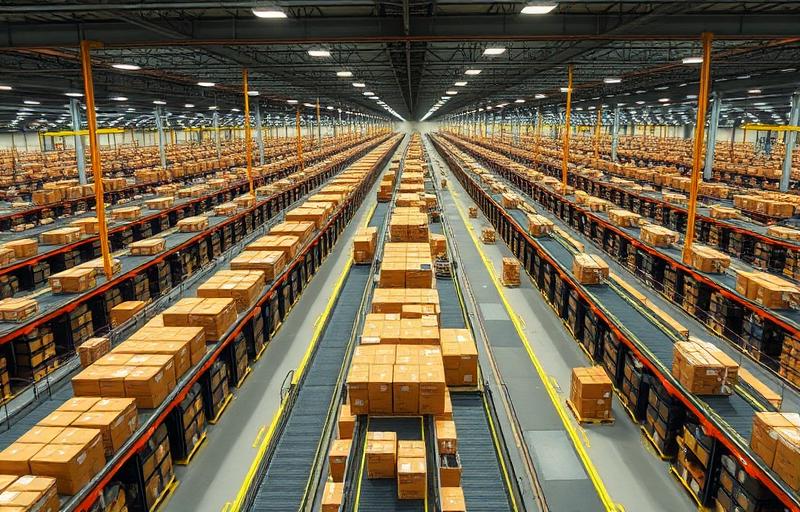
Every second, roughly 18 people somewhere in the world click "Buy Now" on Amazon. Before this paragraph ends, over 200 orders have been placed — triggering a cascade of warehouse robots, packing stations, delivery trucks, and doorbell cameras. Amazon's 1.6 million daily orders represent one of the most complex logistics operations in human history, involving over 1,500 fulfillment centers, 400,000 delivery drivers, and a fleet of 85 cargo aircraft.
What makes this number particularly striking is its consistency. Unlike retail stores with clear peaks and troughs, Amazon's global reach means orders flow continuously across time zones. When Americans sleep, European and Asian customers are awake and shopping. The result is a near-constant stream of commerce that never pauses — and that ripples into global credit card transaction volume, payment processor revenues, and last-mile delivery networks every minute of every day.
From an online bookstore to 1.6M orders / day
- 1995~1 / day
Bezos launches Amazon from a Bellevue garage.
- 2005~50K / day
Prime launches with 2-day shipping for $79/yr.
- 2015~500K / day
Prime Day debuts on Amazon's 20th birthday.
- 2020~1.2M / day
COVID drives ecommerce penetration to record levels.
- 2026~1.6M / day
Same-day delivery, AI shopping agents and TikTok Shop boost frequency.
How the Order Volume Is Estimated
Amazon doesn't publish exact daily order counts. Analysts derive estimates from quarterly revenue figures, average order values (approximately $50–55 in 2026), and the split between first-party sales and third-party marketplace transactions. Third-party sellers now account for roughly 60% of all units sold on Amazon, meaning independent businesses fulfill the majority of the platform's orders.
The 1.6 million figure accounts for Amazon's total global marketplace including the US, UK, Germany, Japan, India, Australia, and other regional sites. Prime members — over 220 million worldwide — drive a disproportionate share of orders, averaging 25–30 orders per year compared to 10–15 for non-Prime customers.
Amazon daily order volume — historical trend
| Year | Orders placed per day (worldwide) |
|---|---|
| 2005 | ~50,000 |
| 2010 | ~150,000 |
| 2015 | ~500,000 |
| 2019 | ~900,000 |
| 2020 | ~1.2 million |
| 2023 | ~1.45 million |
| 2026 | ~1.6 million |
Sources: Amazon annual reports, eMarketer, Statista, Marketplace Pulse. Figures rounded.
The Logistics Behind Every Order
When you place an Amazon order, a sophisticated algorithm determines the optimal fulfillment center within milliseconds. Factors include proximity to your address, item availability, shipping speed commitment, and current warehouse workload. In many fulfillment centers, robotic "drives" — small orange robots — carry shelving units to human workers, reducing walking time and enabling a single packer to process 200–300 items per hour.
The last-mile delivery challenge is Amazon's biggest operational cost. The company has built its own delivery network (Amazon Logistics) to reduce dependence on UPS and FedEx, deploying hundreds of thousands of branded vans, electric vehicles, and even drones in pilot programs. In 2026, Amazon Logistics handles approximately 72% of its own US deliveries — up from roughly 50% just four years earlier.

Did you know?
Every second…
~18.5 Amazon orders are placed — somewhere on Earth, every single second.
2.5M packages
Daily order count is 1.6M but shipments hit 2.5M — orders often split across warehouses.
60% are 3rd-party
Independent sellers on Amazon Marketplace now fulfil the majority of all units sold.
One Prime Day
Generates ~375M items sold over 48 hours — roughly 5× a normal day's order rate.

Peak Days and Seasonal Surges
While the daily average sits at 1.6 million, Amazon's order volume surges dramatically during key events. Prime Day, typically held in July, generates over 375 million items sold across 48 hours — roughly 7.8 million orders per day. Black Friday and Cyber Monday push volumes even higher, with peak rates exceeding 10 million orders in a single day. During these events, Amazon pre-positions inventory weeks in advance, hires over 250,000 seasonal workers, and extends fulfillment center operating hours to 24/7.
Conversely, the slowest periods — typically late January through February — see daily volumes dip to approximately 1.1–1.2 million orders. This seasonal pattern mirrors broader retail trends but is less pronounced than brick-and-mortar stores, thanks to the convenience factor that drives consistent online purchasing year-round.
Environmental and Economic Footprint
Processing 1.6 million orders daily generates an enormous environmental footprint. Amazon estimates its operations produced 71.3 million metric tonnes of CO₂ equivalent in 2023, with logistics and packaging contributing the largest share — feeding directly into global daily CO₂ emissions. The company has pledged to reach net-zero carbon by 2040 and has ordered over 100,000 electric delivery vans from Rivian — the largest electric vehicle order in history.
Economically, Amazon's daily operations support roughly 1.5 million direct employees and an estimated 3 million additional jobs through its third-party marketplace ecosystem. The platform has become essential infrastructure for millions of small businesses, with over 2 million active sellers worldwide depending on Amazon as their primary or exclusive sales channel.
Data & transparency
- Source
- Amazon annual reports, eMarketer, Statista, Marketplace Pulse
- Update frequency
- Annual baseline; live counter updates every second
- Calculation
- Annual Amazon orders (~584M/yr) ÷ 31,536,000 seconds
- Last updated
Sources & further reading
- Amazon Investor Relations — Annual Reports— Amazon.com Inc.
- eMarketer — US Ecommerce Market Share— eMarketer
- Statista — Amazon Statistics & Facts— Statista
- Marketplace Pulse — Amazon Marketplace Data— Marketplace Pulse