
Quick facts
- ▸~115,000 commercial flights take off every day worldwide in 2026 — about 80 per minute.
- ▸At peak, 13,000–15,000 aircraft are airborne simultaneously.
- ▸~13 million passengers fly every day — 4.7 billion per year.
- ▸Aviation generates ~2.5 million tonnes of CO₂ per day (~2.5% of global emissions).
- ▸The US (25K), China (18K) and India (7K) dominate domestic flight volume.
While you've been on this page…
Live, since you opened the page — at typical worldwide rates.
+1
Flights taking off · ~80 / min
+23,107
Aviation CO₂ (kg) · ~29t / sec
+7,411
Jet fuel burned (L) · ~9.3K / sec
Flights in perspective
Flights / day
~115K
Commercial + cargo
Airports
~9,500
Worldwide
On average, every airport handles ~12 takeoffs every single day.
US flights / day
~25,000
Domestic + intl.
China flights / day
~18,000
Domestic + intl.
The US and China alone account for over a third of all daily flights.
Daily revenue
~$2.7B
Industry total
Daily fuel cost
~$640M
800M L of jet fuel
Fuel is the single largest variable cost — and largest CO₂ driver — in aviation.
A Sky That Never Sleeps
Look up anywhere on Earth at any moment, and there's a good chance an aircraft is above you. With 115,000 flights departing daily — roughly one every 0.75 seconds — the global aviation network operates as a continuous, planet-spanning transportation machine. At peak hours, over 15,000 aircraft occupy airspace simultaneously, each carrying anywhere from a handful of passengers to over 500 souls on wide-body international routes.
The scale of modern aviation is easy to overlook. In any given hour, 4,800 flights are airborne — more than the total number of airports in the United States. By the time you've finished dinner, 20,000 flights have completed their journeys, ferrying millions of travelers, tons of cargo, and billions of dollars in economic value across borders, oceans and time zones.
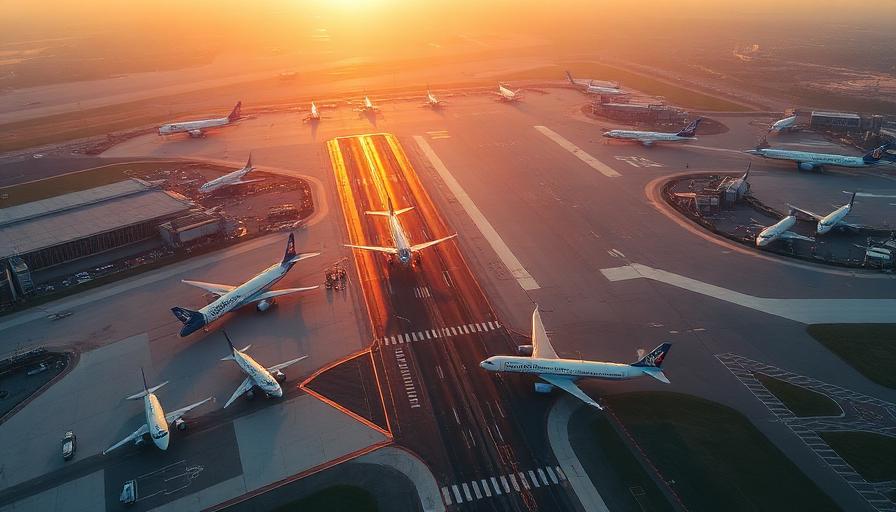
From Wright Brothers to 115,000 flights / day
- 19141 / day
First scheduled airline flight — 23 minutes across Tampa Bay, $5 ticket.
- 1960~10K / day
Jet age opens commercial aviation to the middle class.
- 2000~70K / day
Low-cost carriers expand globally.
- 2019~125K / day
Pre-pandemic peak — 4.5 billion annual passengers.
- 2020~30K / day
COVID-19 collapses global aviation overnight.
- 2026~115K / day
Full recovery; emerging-market growth pushes new records.
How Daily Flight Counts Are Tracked
Unlike social media metrics that rely on estimates, flight data is precise. Every commercial flight files a flight plan with air traffic control authorities, and tracking services like FlightAware, Flightradar24 and Cirium monitor aircraft using a combination of ADS-B transponder signals, radar data and satellite tracking. This provides near-real-time visibility of every commercial aircraft on Earth.
The 115,000 daily figure includes scheduled commercial passenger flights (~90,000), cargo-only flights (~10,000), charter flights (~5,000) and business/general aviation jets (~10,000). Military flights and untracked private aircraft are excluded. The number fluctuates seasonally — summer peaks see 125,000+ daily flights, while January and February dip to around 105,000.
Daily commercial flights worldwide — historical trend
| Year | Average flights per day |
|---|---|
| 1960 | ~10,000 |
| 2000 | ~70,000 |
| 2010 | ~92,000 |
| 2019 | ~125,000 |
| 2020 | ~30,000 |
| 2023 | ~108,000 |
| 2026 | ~115,000 |
Sources: IATA, ICAO, FlightAware, Cirium. Figures rounded.
Did you know?
Every minute…
~80 flights take off somewhere on Earth — roughly one every 0.75 seconds.
Busiest route
Jeju ↔ Seoul (South Korea) sees ~180 flights per day over just 450 km.
Longest non-stop
Singapore ↔ New York covers 16,000+ km — 18 hours airborne, 100,000+ L of fuel per trip.
Cargo punches above its weight
Air cargo is just 1% of global trade by volume — but 35% by value.
The Numbers Behind the Numbers
Each of those 115,000 daily flights carries economic significance. The global airline industry generates approximately $2.7 billion in revenue per day. It employs 87 million people worldwide (directly and through supply chains). The cargo segment alone moves $18 billion worth of goods daily — representing 35% of global trade by value, though only 1% by volume.
The fuel consumed is staggering: roughly 800 million liters of jet fuel per day, costing airlines approximately $640 million. This makes aviation one of the world's largest consumers of refined petroleum products, and the resulting 2.5 million tons of daily CO₂ emissions place aviation at the center of climate policy debates.
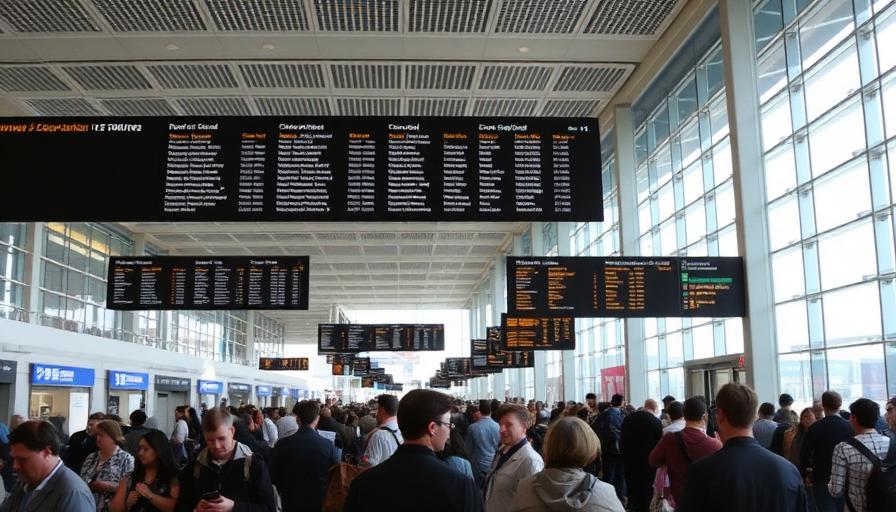
Growth Trajectory: 140,000 Daily Flights by 2035?
The growth trajectory is driven primarily by emerging markets. India's domestic aviation market grew 15% annually between 2022 and 2026. Southeast Asian low-cost carriers — AirAsia, Lion Air, VietJet — have made flying accessible to hundreds of millions of first-time flyers. IATA projects 6 billion annual passenger trips by 2035, meaning daily flights could surpass 140,000 within a decade — adding to global CO₂ emissions and intensifying pressure on sustainable fuel technologies.
Data & transparency
- Source
- IATA, ICAO, FlightAware, Cirium Aviation Analytics
- Update frequency
- Annual baseline; live counter updates every second
- Calculation
- Annual commercial flights (~42M/yr) ÷ 31,536,000 seconds
- Last updated
Sources & further reading
See also: CO₂ emissions per day · Money printed per day · Births per day · All economy counters