
The Invisible River of Daily Demand
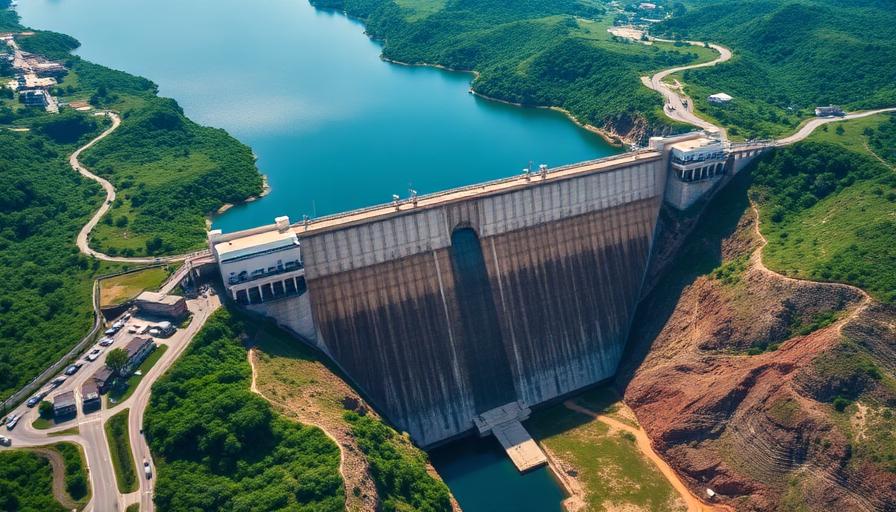
Ten trillion liters. It's a number so enormous it resists comprehension. Every day, humanity draws from rivers, aquifers, lakes, and reservoirs a volume of freshwater that would fill Lake Geneva — one of Europe's largest lakes — nearly twice over. This water irrigates croplands, cools power plants, fills swimming pools and bathtubs, and flows through factories producing everything from microchips to concrete.
Most people think of water consumption as the tap running while brushing teeth. But direct household use represents barely 10% of the global total. The true water story is hidden in the fields: every kilogram of rice requires 2,500 liters to grow. A single cotton t-shirt takes 2,700 liters. A kilogram of beef demands 15,400 liters. When you eat breakfast, you're consuming hundreds of liters of "embedded" water you never see.
How Global Water Consumption Is Measured
The UN's AQUASTAT database, maintained by the Food and Agriculture Organization (FAO), is the primary global source. National governments report water withdrawal data from metered municipal supplies, irrigation district records, and industrial permits. Satellite remote sensing, particularly NASA's GRACE satellite system, measures groundwater depletion by detecting minute changes in Earth's gravitational field.
An important distinction exists between "withdrawal" and "consumption." Withdrawal refers to water taken from a source; consumption refers to water that doesn't return to the source (lost to evaporation, absorbed by crops, or incorporated into products). The 10 trillion liter daily figure refers to total withdrawals. Actual consumption — water permanently removed from the cycle — is roughly 4.5 trillion liters per day.
The Three Sectors Draining the Planet
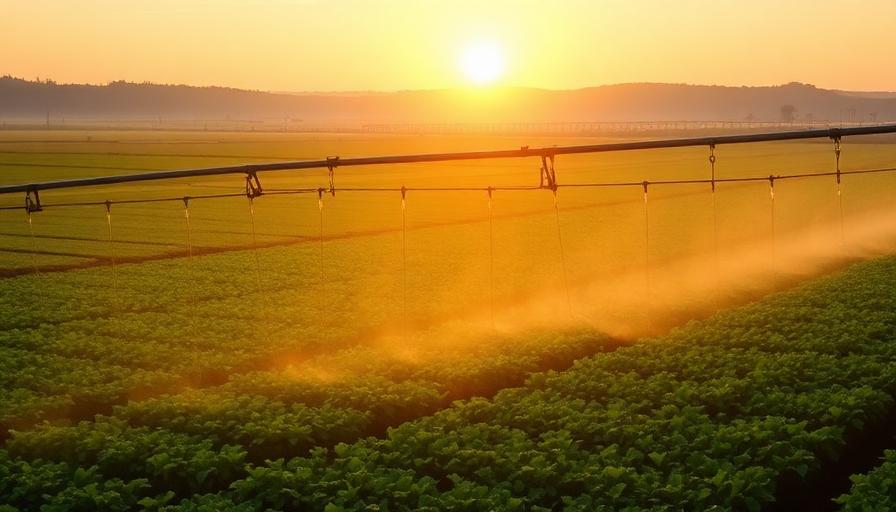
Agriculture dominates with 70% of all freshwater withdrawals — roughly 7 trillion liters daily. Flood irrigation, the oldest and least efficient method, still accounts for over 85% of irrigated agriculture in developing nations, losing 50–60% of water to evaporation before crops can absorb it. Drip irrigation and precision agriculture could halve agricultural water use, but adoption remains slow outside wealthy nations.
Industry claims 20% — roughly 2 trillion liters daily. Thermoelectric power generation alone consumes 400 billion liters per day for cooling. Manufacturing, mining, and construction account for the remainder. Domestic use — household taps, toilets, showers, and laundry — takes the final 10%, roughly 1 trillion liters daily, though per-capita domestic use varies 50-fold between the highest-consuming nations (US, Australia) and the lowest (Ethiopia, Chad).
Comparisons That Bring the Scale to Life
Ten trillion liters per day is equivalent to 4 million Olympic swimming pools being emptied and refilled every 24 hours. The daily flow rate (116 million liters per second) exceeds the discharge of the Amazon River — the world's mightiest — which flows at roughly 209 million liters per second. Humanity's daily thirst rivals a major geological force.
If you allocated the daily consumption equally to every person alive, each would receive about 1,200 liters — enough to fill 15 standard bathtubs. But distribution is wildly unequal: an average American uses 7,800 liters per day (including embedded water), while a subsistence farmer in sub-Saharan Africa may access fewer than 20 liters for all direct needs.
The Growing Gap: Demand vs. Supply
Global water demand has increased six-fold over the past century and continues growing at roughly 1% per year. By 2030, the World Resources Institute projects a 40% gap between freshwater supply and demand under business-as-usual scenarios. Climate change intensifies the crisis — shifting precipitation patterns, shrinking glaciers that feed major rivers, and increasing evaporation from reservoirs.
Groundwater depletion presents the most urgent threat. Aquifers beneath India's Punjab breadbasket, California's Central Valley, and Saudi Arabia's irrigated regions are being pumped far faster than natural recharge can replenish them. NASA's GRACE data shows the Indus Basin aquifer — supplying water for 300 million people — could be functionally depleted within decades at current extraction rates.
Related Environmental Data
Water consumption connects to broader environmental and population dynamics. Explore related counters:
- 150 million tons of CO₂ per day — climate change intensifies water scarcity
- 385,000 births per day — population growth increases water demand
- 42 million trees cut per day — deforestation disrupts watershed health
- What happens every second? — the full picture of global real-time activity