
Quick facts
- ▸~1.1 million metric tons of plastic waste generated every day worldwide.
- ▸Only ~9% of all plastic ever produced has actually been recycled.
- ▸22,000–33,000 tons of plastic enter the ocean every day.
- ▸10 rivers — mostly in Asia — carry ~90% of ocean-bound plastic.
- ▸Most plastics persist for 400–1,000 years before fully breaking down.
While you've been on this page…
Live, since you opened this page — at typical worldwide rates.
+10
Plastic waste (tons) · ~12.7 / sec
+0
Ocean leakage (tons) · ~0.3 / sec
+18,473
Plastic bottles · ~23K / sec
Plastic waste in perspective
Plastic waste / day
~1.1M t
Worldwide
Ocean leakage
22K–33K t
Daily estimate
Only a small share reaches the ocean, but that still means tens of thousands of tons per day.
Produced since 1950
10B+ t
All plastics
Ever recycled
~9%
Global estimate
Plastic is mostly a one-way material flow: produce, use briefly, then discard.
Waste / day
~1.1M t
Plastic
CO₂ / day
~101M t
Emissions
Plastic is smaller by mass than CO₂, but it persists visibly for centuries.
A Million Tons Before Midnight
Every 24 hours, humanity generates enough plastic waste to fill roughly 55,000 standard garbage trucks. Lined up bumper to bumper, that convoy would stretch from London to Moscow. By the time you've read this sentence, another 50 tons of plastic waste entered the global waste stream — most of it destined for landfills, incinerators, or worse, the natural environment.
The sheer velocity of plastic generation is a distinctly modern phenomenon. In 1950, the world produced just 2 million tons of plastic per year — total. Today, that same amount is generated in less than two days. Plastic production has grown at a compound rate of roughly 8% annually since the 1950s, outpacing nearly every other manufactured material in human history.
How Daily Plastic Waste Is Calculated
The OECD's Global Plastics Outlook provides the most comprehensive dataset. Their methodology combines plastic production data from industry groups (PlasticsEurope, American Chemistry Council), trade flow analysis, product lifetime modeling, and waste management statistics from national environmental agencies. The 400 million tons per year figure accounts for all polymers: packaging, construction, textiles, electronics, automotive, and consumer goods.
Dividing by 365 yields roughly 1.1 million tons per day. However, waste generation isn't evenly distributed across the calendar — holiday seasons, particularly around Christmas and Chinese New Year, see packaging waste spike by 25–40% above daily averages in affected regions.
Where Does a Million Daily Tons Go?
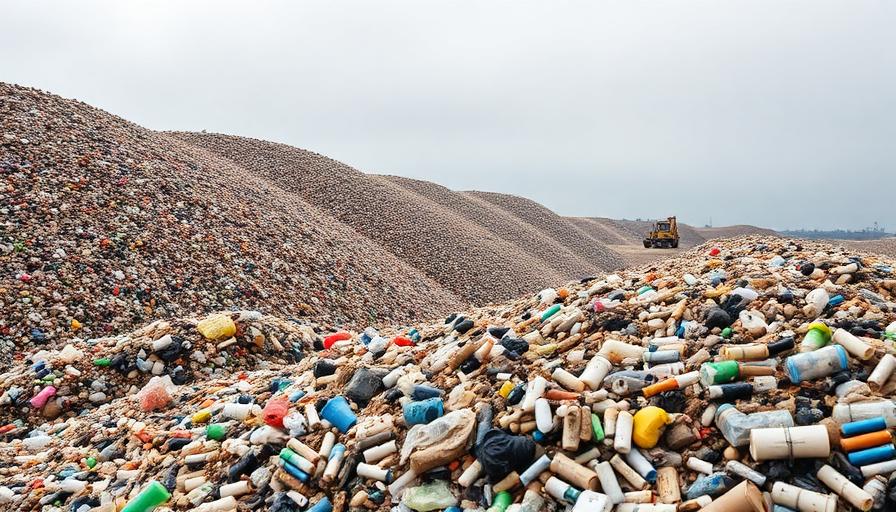
Of the 1.1 million daily tons, approximately 40% goes to landfill, 25% is incinerated (sometimes for energy recovery), 14% is collected for recycling (with roughly 10% effectively recycled after losses), and a disturbing 22% is mismanaged — dumped in open sites, burned informally, or leaked into waterways and oceans.
That mismanaged 22% — roughly 240,000 tons per day — represents the environmental crisis in its most visible form. Rivers in Southeast Asia, South Asia, and West Africa serve as conduits, carrying an estimated 22,000–33,000 tons of plastic into the ocean daily. The Yangtze, Ganges, and Mekong rivers alone account for an estimated 60% of all ocean-bound plastic pollution.
Global plastic waste generation — historical trend
| Year | Plastic waste generated (metric tons / year) |
|---|---|
| 1950 | ~2 million |
| 1980 | ~50 million |
| 2000 | ~200 million |
| 2019 | ~353 million |
| 2026 | ~400 million |
Sources: OECD Global Plastics Outlook, UNEP, Our World in Data.

Making 1.1 Million Tons Tangible
One million tons is abstract. Here's what it looks like: the daily plastic waste output weighs more than 6,000 fully loaded Boeing 747 aircraft. It would fill the Roman Colosseum to the brim — every single day. If compressed into standard shipping containers, you'd need 45,000 of them daily, enough to form a train stretching 340 kilometers.
Compared to other environmental metrics tracked on this site: the world cuts down 42 million trees per day and emits roughly 150 million tons of CO₂ daily. Plastic waste, while smaller by weight than CO₂ emissions, persists for centuries — accumulating rather than dissipating.
The Trajectory: Rising Despite Awareness
Despite decades of recycling campaigns, plastic bans, and corporate sustainability pledges, global plastic waste continues to grow at approximately 4% annually. Production is projected to triple by 2060 if current trends hold, according to the OECD. The primary driver is packaging — representing 36% of all plastic produced — which is overwhelmingly single-use and discarded within days of purchase.
The geographic distribution of waste generation is shifting. High-income countries still produce the most waste per capita, but absolute growth is concentrated in Asia and Africa, where rapid urbanization and rising consumer spending drive demand for packaged goods. India's plastic waste generation, for instance, has doubled since 2018 and is projected to double again by 2030.
Related Environmental Data
Plastic waste is interconnected with broader environmental challenges. Explore related real-time counters:
- 150 million tons of CO₂ emitted per day — fossil fuels drive both emissions and plastic production
- 42 million trees cut per day — deforestation compounds the waste crisis
- Plastic bottles produced per day — the single most common form of plastic waste
- What happens every second? — the full picture of global real-time activity
Data & transparency
- Source
- OECD Global Plastics Outlook, UNEP, Our World in Data
- Update frequency
- Annual baseline; live counter updates every second
- Calculation
- Estimated 400 million tonnes of annual plastic waste ÷ 365 days ÷ 86,400 seconds
- Last updated
Sources & further reading
- OECD Global Plastics Outlook— OECD
- UNEP — Beat Plastic Pollution— UN Environment Programme
- Our World in Data — Plastic Pollution— Our World in Data
- Geyser, Jambeck & Law (2017) — Production, use, and fate of all plastics ever made— Science Advances