
6.25 Million Tons: Every Single Hour
In the time it takes to watch a movie, humanity pumps over 12 million tons of carbon dioxide into the atmosphere. Every hour, 6.25 million metric tons of CO₂ flow from smokestacks, exhaust pipes, furnaces, and cleared forests into the thin envelope of gas that sustains all life on Earth. The hourly rate gives urgency to what annual statistics can obscure — this isn't a distant trend; it's happening right now, continuously, relentlessly.
To visualize 6.25 million tons: if compressed to the density of water, it would fill 2,500 Olympic swimming pools. Every hour. Released as gas, it occupies a volume roughly equivalent to a sphere 500 meters in diameter — larger than the Empire State Building is tall. And the atmosphere receives this addition 24 times per day, 365 days per year, with no pause button.
How Hourly Emissions Are Calculated
The Global Carbon Project provides the most authoritative annual estimates, combining fossil fuel consumption data from the International Energy Agency (IEA), cement production statistics, and satellite-based measurements of land-use change. Converting to hourly rates involves dividing the annual total (~54.8 billion tons from fossil fuels plus ~5 billion from land use) by 8,766 hours per year.
Real-time verification comes from atmospheric monitoring stations — particularly NOAA's Mauna Loa Observatory in Hawaii, which has tracked CO₂ concentrations continuously since 1958. Satellite missions like NASA's OCO-2 and ESA's Sentinel-5P now provide near-global coverage of CO₂ column measurements, validating bottom-up emission estimates with top-down atmospheric observations.
The Anatomy of an Hour's Emissions
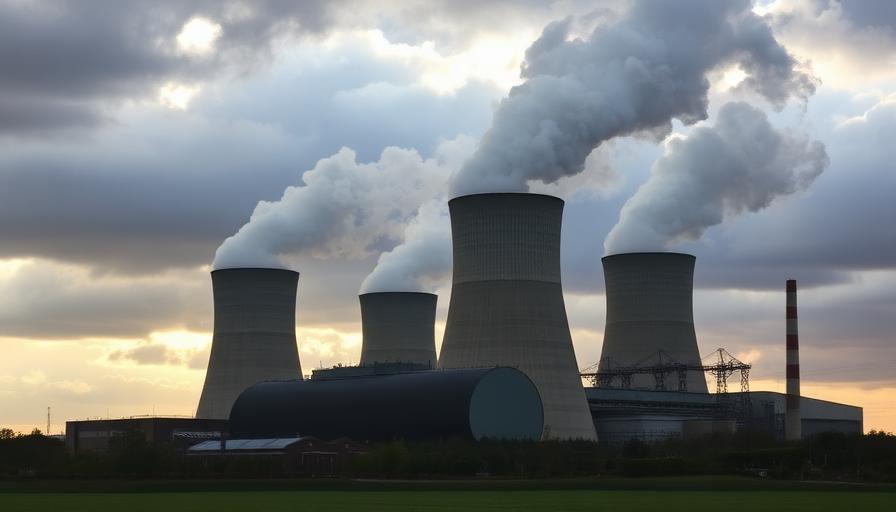
Of the 6.25 million hourly tons, electricity and heat generation account for approximately 2.5 million (40%). This is dominated by coal-fired power plants — particularly in China, India, and Southeast Asia — which alone contribute over 1.5 million tons per hour. Natural gas power plants add another 700,000 tons, while oil-fired generation contributes a diminishing share.
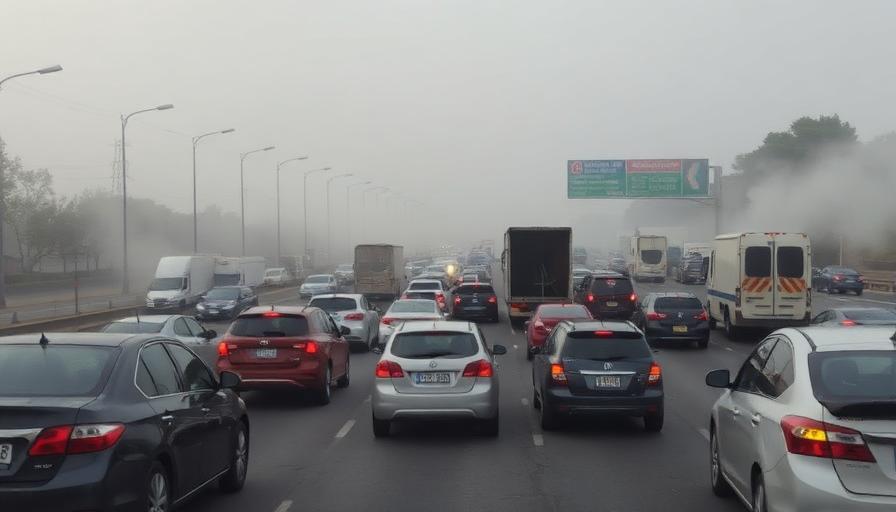
Transportation emits roughly 1.5 million tons per hour (24%), with road vehicles responsible for 75% of that. Aviation adds 290,000 tons hourly, shipping contributes 170,000, and rail accounts for 40,000. Industry — steel, cement, chemicals, and manufacturing — generates 1.3 million tons per hour (21%). Buildings (heating, cooling, cooking) contribute the remaining 15%.
The Absorption Gap: Why It Accumulates
Earth's natural carbon sinks — oceans, forests, soils — absorb roughly 2.4 million tons of CO₂ per hour. That's impressive, but it covers only 38% of the 6.25 million tons emitted. The remaining 3.85 million tons per hour accumulate in the atmosphere, pushing concentrations from 280 ppm (pre-industrial) to over 425 ppm in 2026. This accumulation is the fundamental driver of global warming.
The ocean absorbs about 1.4 million tons per hour but pays a steep price: absorbed CO₂ forms carbonic acid, lowering ocean pH in a process called ocean acidification. Marine pH has dropped 0.1 units since pre-industrial times — a 26% increase in acidity that threatens coral reefs, shellfish, and the entire marine food chain. Meanwhile, deforestation reduces terrestrial absorption capacity by roughly 100,000 tons per hour.
The Race to Cut Hourly Emissions
To limit warming to 1.5°C, the hourly emission rate needs to drop from 6.25 million to approximately 1.5 million tons by 2050 — a 76% reduction. Renewable energy deployment is the fastest lever: every gigawatt of new solar capacity displaces roughly 230 tons of CO₂ per hour compared to coal. In 2026, renewables account for 33% of global electricity, up from 22% in 2015.
Electrification of transport, industrial heat pumps, green hydrogen for steel and cement, and dietary shifts toward plant-based food all contribute to reducing the hourly rate. Carbon capture and storage (CCS) technology can remove CO₂ directly, but current global capacity captures only about 5,000 tons per hour — a fraction of one percent of emissions.

Related Environmental Data
CO₂ emissions connect to a web of environmental metrics tracked in real time:
- 150 million tons of CO₂ per day — the daily total driving climate change
- 42 million trees cut per day — reducing Earth's CO₂ absorption capacity
- 1.1 million tons of plastic per day — fossil fuel-derived waste
- What happens every second? — the full picture of global real-time activity