
1,186 Tonnes Every Tick of the Clock
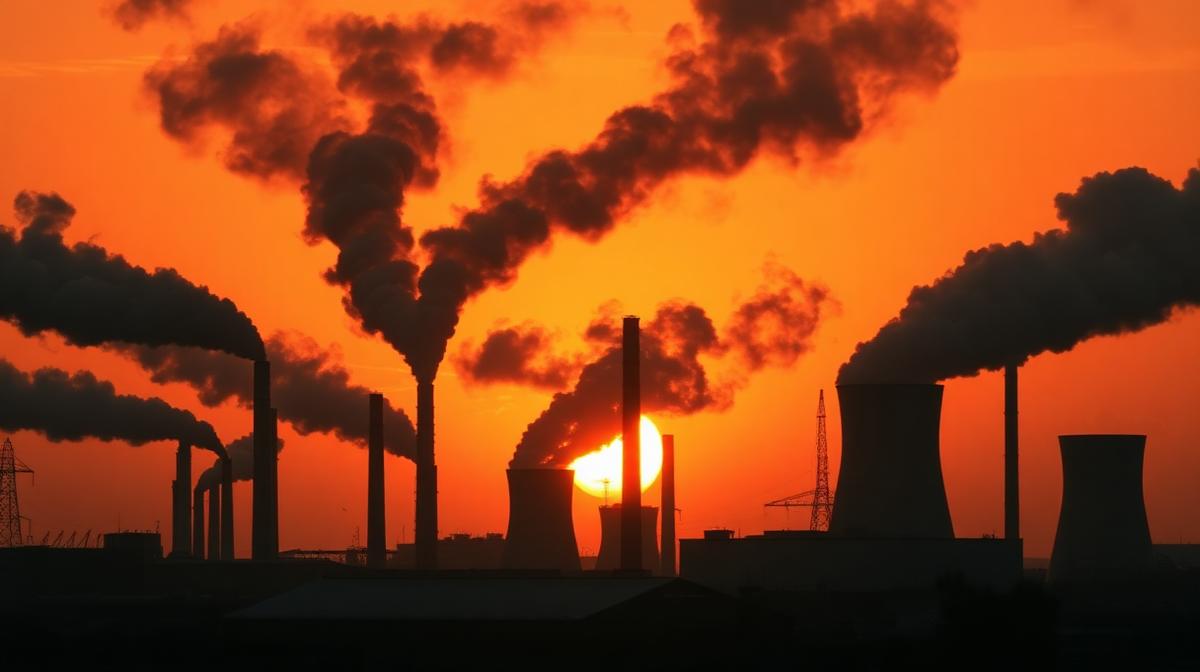
In the time it takes to snap your fingers, humanity has released approximately 1,186 metric tons of carbon dioxide into the atmosphere. That's the weight of roughly 200 adult elephants — launched skyward every second, dispersing into an atmosphere that's been accumulating these emissions since the Industrial Revolution. Unlike a factory you can see smoking, this happens everywhere simultaneously: from tailpipes in Houston, smokestacks in Shenzhen, and gas stoves in Berlin.
The per-second framing strips away the abstraction of annual reports and Paris Agreement targets. Climate change doesn't happen in annual increments — it happens 1,186 tonnes at a time, every second, relentlessly. The atmosphere doesn't wait for policy cycles; it accumulates carbon with atomic indifference.
Breaking Down the Per-Second Sources
The 1,186 tonnes per second comes from identifiable sectors, each contributing a measurable share:
- Electricity & heat: ~474 tonnes/sec (40%) — coal and gas power plants
- Industry: ~260 tonnes/sec (22%) — cement, steel, chemicals
- Transport: ~250 tonnes/sec (21%) — cars, trucks, ships, aviation
- Buildings: ~119 tonnes/sec (10%) — heating, cooling, cooking
- Other: ~83 tonnes/sec (7%) — agriculture, waste, fugitive emissions
China alone contributes approximately 355 tonnes per second (30% of the global total), followed by the United States at roughly 142 tonnes/sec (12%), and the European Union at 95 tonnes/sec (8%). India's rapidly growing economy pushes 89 tonnes per second, with its share increasing annually.
How Per-Second Emissions Are Measured
No single sensor measures global CO₂ output in real time. Instead, the Global Carbon Project compiles data from national emissions inventories (reported to the UNFCCC), satellite measurements of atmospheric CO₂ concentration (via NASA's OCO-2 mission), ground-based monitoring stations (like NOAA's Mauna Loa Observatory), and energy consumption statistics from the International Energy Agency.
The per-second rate is derived from the annual estimate: 37.4 billion tonnes in 2026, divided by 31.536 million seconds. In reality, emissions fluctuate — they spike during Northern Hemisphere winters (heating demand) and during weekdays (industrial activity). Peak seconds may exceed 1,500 tonnes; quiet Sunday mornings in summer might dip below 900.

What 1,186 Tonnes Per Second Does to the Atmosphere
Approximately 45% of each second's emissions remain in the atmosphere — about 534 tonnes per second added to the atmospheric CO₂ burden. The rest is absorbed by oceans (26%) and land ecosystems (29%). This absorption comes at a cost: ocean acidification has increased 30% since pre-industrial times, and forest carbon sinks are becoming less effective as temperatures rise.
The atmospheric concentration of CO₂ has risen from 280 ppm in 1750 to 425 ppm in 2026. Each second's 534 airborne tonnes incrementally pushes that number higher — an invisible but quantifiable contribution to the greenhouse effect that is warming the planet at approximately 0.2°C per decade.
Scale Comparisons That Crystallize the Impact
At 1,186 tonnes per second, one minute of global emissions weighs more than the Titanic. One hour exceeds the weight of every car in New York City. In a single day, humanity emits enough CO₂ to fill 20 billion party balloons — enough to cover the surface of Lake Erie three layers deep.
Compare this to natural carbon cycling: volcanic eruptions release roughly 300–900 million tonnes per year — a volume that human emissions surpass in less than a day. The scale of industrial CO₂ production has no natural precedent in Earth's geological record for at least 66 million years.
Connecting the Dots
CO₂ emissions intertwine with virtually every metric on this site. The 42 million trees cut daily reduce the planet's ability to absorb those 1,186 tonnes per second. The 3.5 million emails per second consume data center energy that contributes measurably to the total. Even 389,000 daily births initiate new carbon footprints that compound over decades.
View the cumulative picture at 102.5 million tonnes per day, or explore the full environmental dashboard on our live environmental statistics page. For the complete view of what happens every second, including both human and planetary metrics.