
A Bottle Every 0.06 Seconds
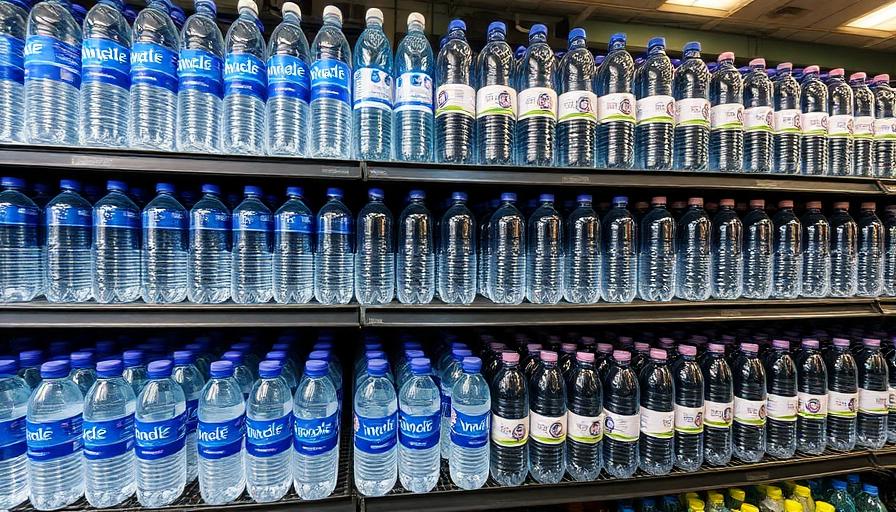
Before you finish reading this sentence, 50,000 new plastic bottles rolled off production lines worldwide. At 1.37 billion per day, the global appetite for single-use PET bottles has become one of the defining material flows of modern civilization. These bottles hold water, soda, juice, cooking oil, cleaning products, and personal care items — a ubiquitous container that most people use for minutes and that persists for centuries.
The scale resists comprehension through numbers alone. Stacked end to end, one day's production of bottles would stretch from Earth to the Sun and halfway back — over 200 million kilometers. Laid flat, they would cover an area twice the size of Manhattan. And tomorrow, another 1.37 billion will appear, adding to an ever-growing mountain that recycling infrastructure cannot remotely keep pace with.
How Daily Production Is Tracked
Euromonitor International, the market research firm, provides the most-cited global production estimates by aggregating data from PET resin producers, bottle manufacturers, and beverage companies. The Ellen MacArthur Foundation's New Plastics Economy reports cross-reference this with trade flow data and waste stream analysis. Production figures are also verified through PET resin consumption data from petrochemical industry associations.
The 500 billion annual figure (1.37 billion daily) includes all PET bottles globally — not just beverage containers. Water bottles account for roughly 40%, carbonated drinks 25%, juices and flavored beverages 15%, and non-food applications (cleaning products, personal care, cooking oil) make up the remaining 20%. Bottled water alone has been the fastest-growing segment, with production increasing 9% annually since 2015.
The Recycling Myth: Where Bottles Actually Go
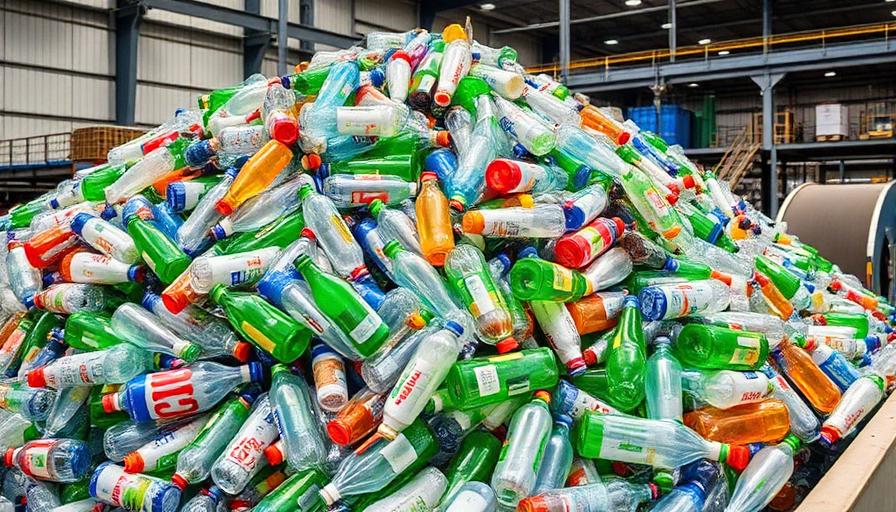
Industry messaging has long emphasized recyclability, but the reality is stark. Of the 1.37 billion bottles produced daily, only about 30% (410 million) enter recycling streams. Of those, contamination and processing losses mean roughly 25% (340 million) are actually reprocessed into new material. That means only 1 in 4 plastic bottles produced achieves any form of recycling — and most of that is "downcycled" into lower-quality products like polyester fiber or fleece, not new bottles.
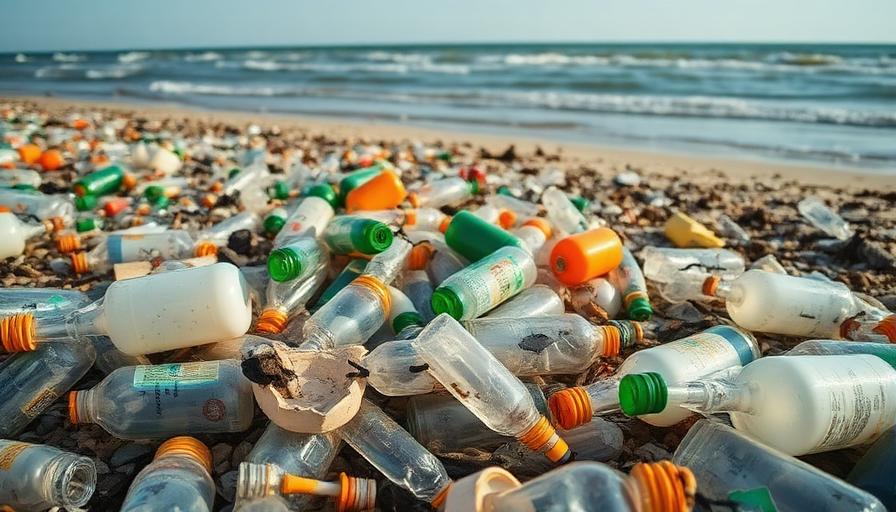
The remaining 70% — nearly 1 billion bottles per day — follows three paths: approximately 50% goes to landfill, 20% is incinerated (sometimes for energy recovery), and an estimated 5–8% enters the natural environment through littering, inadequate waste management, or open dumping. That's 70–110 million bottles per day becoming environmental pollution, with 8–12 million reaching the ocean.
The Environmental Weight of Every Bottle
Each PET bottle requires approximately 3 liters of water to produce (including the water used to make the plastic), 0.25 liters of petroleum-based feedstock, and generates roughly 82 grams of CO₂ across its lifecycle. Multiplied by 1.37 billion daily, the carbon footprint of plastic bottle production alone reaches 112,000 metric tons of CO₂ per day — comparable to the daily emissions of a country like Denmark.
The irony of bottled water is particularly acute: in most developed countries, tap water meets or exceeds the quality standards of bottled water, yet consumers pay 300–2,000 times more per liter for the bottled version. The bottled water industry thrives on convenience, marketing, and — in some regions — genuine infrastructure failures that make tap water unreliable or unsafe.
Growth: A Problem Accelerating, Not Shrinking
In 2004, the world produced 300 billion plastic bottles annually. By 2016, that reached 480 billion. In 2026, the figure stands at 500 billion — and projections suggest 580 billion by 2030. Growth is concentrated in developing markets where urbanization, rising incomes, and inadequate municipal water infrastructure drive demand for bottled water and packaged beverages.
Deposit return schemes (like Germany's Pfand system, which achieves 98% bottle return rates) and legislation banning single-use plastics have proven effective where implemented. However, these policies cover only a small fraction of global production. Without dramatic policy shifts, the trajectory points toward 2 billion bottles per day by the mid-2030s.
Related Environmental Data
Plastic bottle production connects to broader environmental and waste management challenges:
- 1.1 million tons of plastic waste per day — bottles are the most visible component
- 150 million tons of CO₂ per day — bottle production contributes 112,000 tons daily
- 10 trillion liters of water used daily — bottle production adds to water stress
- What happens every second? — the full picture of global real-time activity