
61 Million Lives: The Annual Reckoning
Every year, roughly 61 million human lives reach their conclusion. That's more than the entire population of Italy — vanishing from the Earth and being replaced by the next generation. While the number carries an inherent gravity, understanding its composition reveals the state of global health, inequality, and progress. Behind every statistic is a person, a family, a community altered forever.
The annual death toll, while enormous, is actually a testament to human progress. A century ago, the global death rate was nearly double what it is today. Vaccines, antibiotics, sanitation, and nutrition improvements have extended the average human lifespan from 31 years in 1900 to over 73 years in 2026. Yet the absolute number of deaths grows because the population has expanded from 1.6 billion to over 8.1 billion.
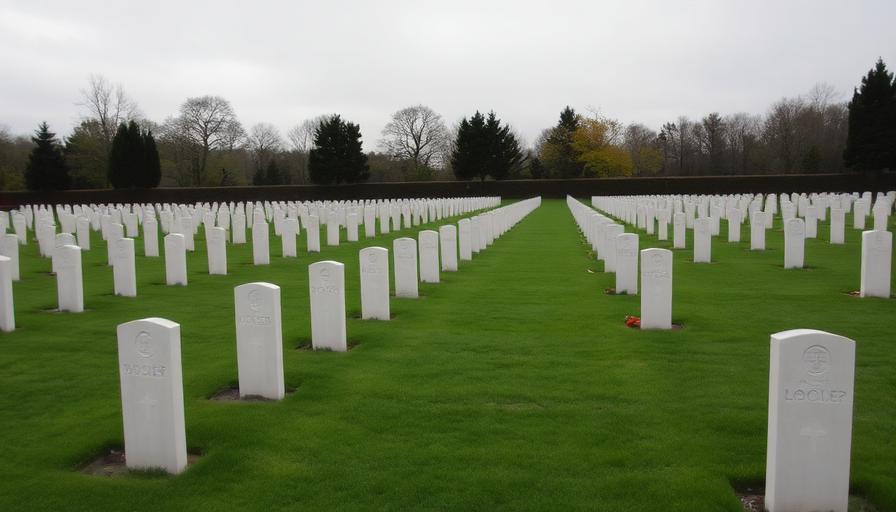
How Annual Mortality Is Tracked
The WHO compiles mortality data from national vital registration systems — the birth and death certificates that governments maintain. In developed nations with comprehensive civil registration, over 95% of deaths are officially recorded. In sub-Saharan Africa and parts of South Asia, however, as few as 30–40% of deaths are formally registered, requiring statistical modeling to fill gaps.
The Global Burden of Disease (GBD) study, led by the Institute for Health Metrics and Evaluation (IHME), provides the most detailed cause-of-death analysis. They combine vital registration data, hospital records, verbal autopsy surveys, and demographic modeling to estimate mortality by cause, age, sex, and location for every country and territory on Earth.
What Kills 61 Million People Per Year?
Cardiovascular diseases dominate, claiming 17.9 million lives annually (29%). Cancer follows at 10 million (16%). Chronic respiratory diseases account for 4.1 million, while lower respiratory infections and neonatal conditions each claim roughly 2.5 million. Diabetes contributes 2 million deaths, and road injuries add 1.35 million — a number equivalent to a major earthquake every two weeks.
The geography of death reflects global inequality in stark terms. In high-income countries, 70% of deaths occur after age 70, mostly from chronic diseases. In low-income countries, nearly 40% of deaths occur before age 15, largely from infectious diseases, malnutrition, and complications during childbirth. A child born in Sierra Leone faces a 50x higher risk of dying before age 5 compared to one born in Japan.

Scale Comparisons: Grasping 61 Million
Sixty-one million is equivalent to emptying the entire United Kingdom — every man, woman, and child — every single year. It's roughly the combined population of Scandinavia, the Netherlands, and Belgium disappearing annually. If those 61 million people stood shoulder to shoulder, the line would stretch from Earth to the Moon — and back again, twice.
Yet this number exists within a larger context: roughly 140 million babies are born per year, meaning Earth gains approximately 79 million net new humans annually. The balance between daily deaths and daily births shapes every aspect of society, from pension systems to housing markets.
The Shifting Landscape of Mortality
The composition of global deaths is undergoing a dramatic transition. Non-communicable diseases (heart disease, cancer, diabetes) now cause 74% of all deaths worldwide, up from 60% in 2000. Infectious disease deaths have declined by nearly 40% in two decades — a triumph of vaccination, HIV treatment, and malaria control programs. But antibiotic resistance threatens to reverse this progress, with drug-resistant infections already causing an estimated 1.27 million deaths annually.
Mental health has emerged as an increasingly significant mortality factor. Suicide claims roughly 700,000 lives per year globally, making it the fourth-leading cause of death among 15–29-year-olds. Substance abuse disorders contribute to an additional 500,000 deaths annually through overdose, organ damage, and related accidents — a category that has tripled in two decades in North America.
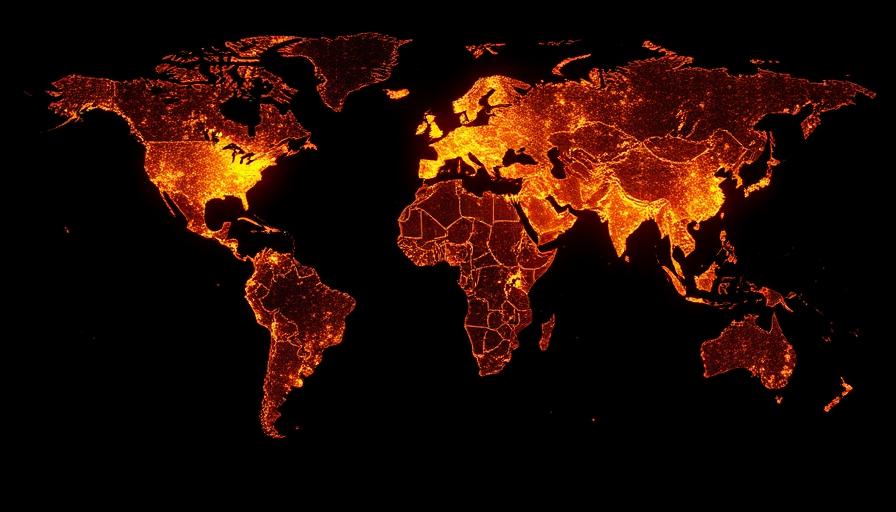
Related Population Data
Annual mortality connects to the broader dynamics of global population:
- 140 million births per year — births exceed deaths by 2.3:1
- 1.9 deaths per second — the per-second pace of global mortality
- 700 billion heartbeats per day — the collective pulse of humanity
- What happens every second? — the full picture of global real-time activity