
The Quiet Constant Behind the Number
Every heartbeat you feel corresponds to roughly two human departures somewhere on this planet. An elderly grandmother in rural Japan, a malaria patient in West Africa, a construction worker in Bangladesh, a cancer survivor in Sweden — 1.9 lives reaching their conclusion with each tick of the clock. Unlike birth, which often carries anticipation and planning, most of the world's 1.9 deaths per second arrive without ceremony or witness.
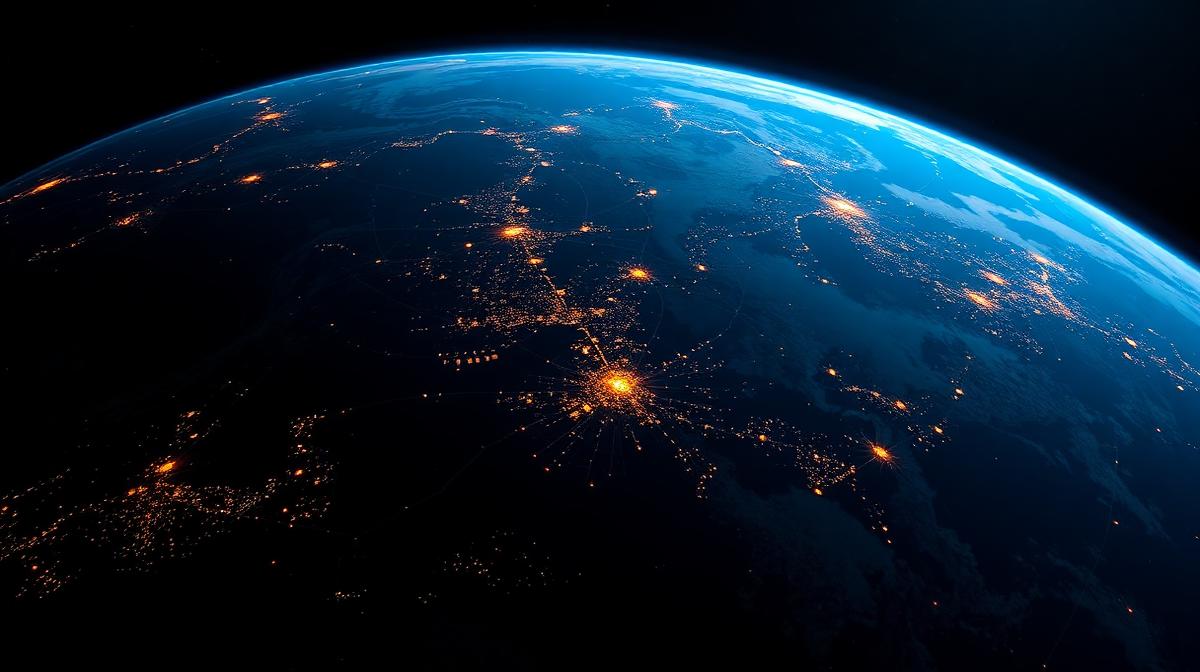
This number is simultaneously clinical and deeply human. Behind each fraction is a person with a name, a history, and people who will mourn them. Yet from the satellite view of global statistics, the regularity is almost mechanical — never speeding up or slowing down by more than a few percentage points across decades.
What Causes 1.9 Deaths Every Second?
The composition of global mortality has shifted dramatically over the past century. In 1900, infectious diseases dominated — tuberculosis, influenza, diarrheal illnesses. Today, non-communicable diseases account for 74% of the 1.9 per-second total. Cardiovascular disease alone claims roughly 0.55 deaths per second, followed by cancers (0.30/sec), chronic respiratory diseases (0.12/sec), and diabetes (0.06/sec).
Injuries — including road traffic accidents, falls, drowning, and violence — contribute about 0.15 deaths per second. Self-harm accounts for approximately 0.025 per second (roughly 800,000 per year), making it a leading cause of death among 15–29-year-olds globally. The remaining fraction includes infectious diseases that continue to claim lives disproportionately in lower-income nations.
Geographic Patterns in Global Mortality
Of the 1.9 deaths per second, approximately 0.5 occur in South and East Asia, 0.35 in Sub-Saharan Africa, 0.3 in Europe, and 0.15 in the Americas. But the causes differ radically by region. In high-income countries, heart disease and cancer dominate. In Sub-Saharan Africa, infectious diseases including HIV/AIDS, malaria, and tuberculosis still account for over 40% of deaths.
Life expectancy creates a stark divide: the average person in Japan lives to 85; in Sierra Leone, to 55. This 30-year gap means the "typical" death per second looks fundamentally different depending on geography — an elderly person dying of organ failure in Tokyo versus a child dying of preventable disease in Freetown.
The Population Balance Sheet
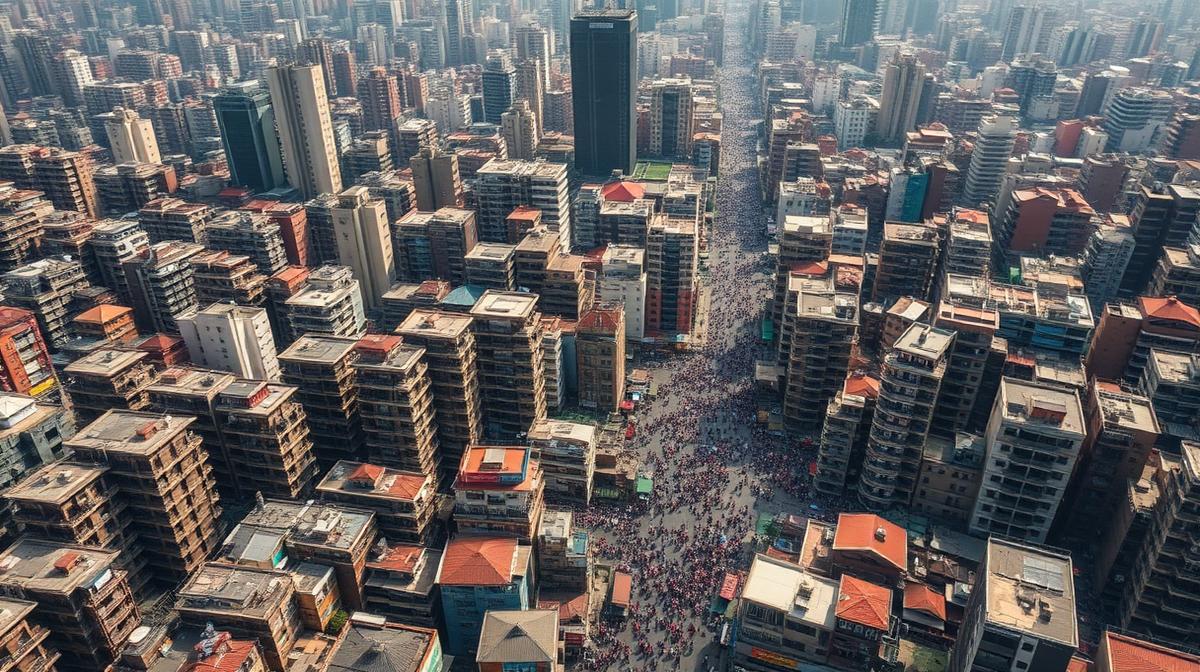
With 4.5 births per second and 1.9 deaths per second, the planet gains approximately 2.6 people every second. This net gain has been the engine of population growth for centuries, but the gap is slowly narrowing. By mid-century, deaths per second are projected to exceed 2.2 while births decline toward 3.8 — compressing the growth margin.
In over 30 countries — including Japan, Italy, South Korea, and Germany — deaths already outnumber births. These nations experience negative natural population growth, offset only by immigration. This reversal, still rare globally, offers a preview of what demographic models suggest will become widespread by the 2070s.
How Mortality Data Is Collected
Accurate death registration remains a challenge. Only about 60% of the world's deaths are formally recorded in civil registration systems. The WHO and Institute for Health Metrics and Evaluation (IHME) fill gaps using verbal autopsy surveys, hospital discharge records, police reports, and statistical modeling to produce the global estimates behind the 1.9 per-second figure.
During COVID-19, the challenge of accurate death counting became globally visible. Excess mortality analysis — comparing actual deaths to historical baselines — revealed that official pandemic tolls underestimated true mortality by 2–3x in many countries. This experience has since driven investment in better death registration infrastructure worldwide.

Understanding Scale Through Comparison
At 1.9 deaths per second, the world loses the equivalent of a small town's population every 6 hours. Over a year, approximately 60 million people die — more than the population of South Korea or Spain. If each death were represented by a grain of sand, one year of global mortality would fill roughly 40 dump trucks.
View the daily total of 164,000 deaths per day, or compare against daily births to see the full population equation. For the complete real-time snapshot of global activity, explore what happens every second in the world.