
15.3 Billion Trees: A Forest Disappearing Annually
Every year, an area of forest roughly the size of Portugal vanishes from the Earth's surface. That translates to 15.3 billion individual trees — felled by chainsaws, cleared by fire, or bulldozed for farmland. To put this in spatial terms: if you planted those 15.3 billion trees in a single row, the line would stretch from Earth to Mars and back, twice.
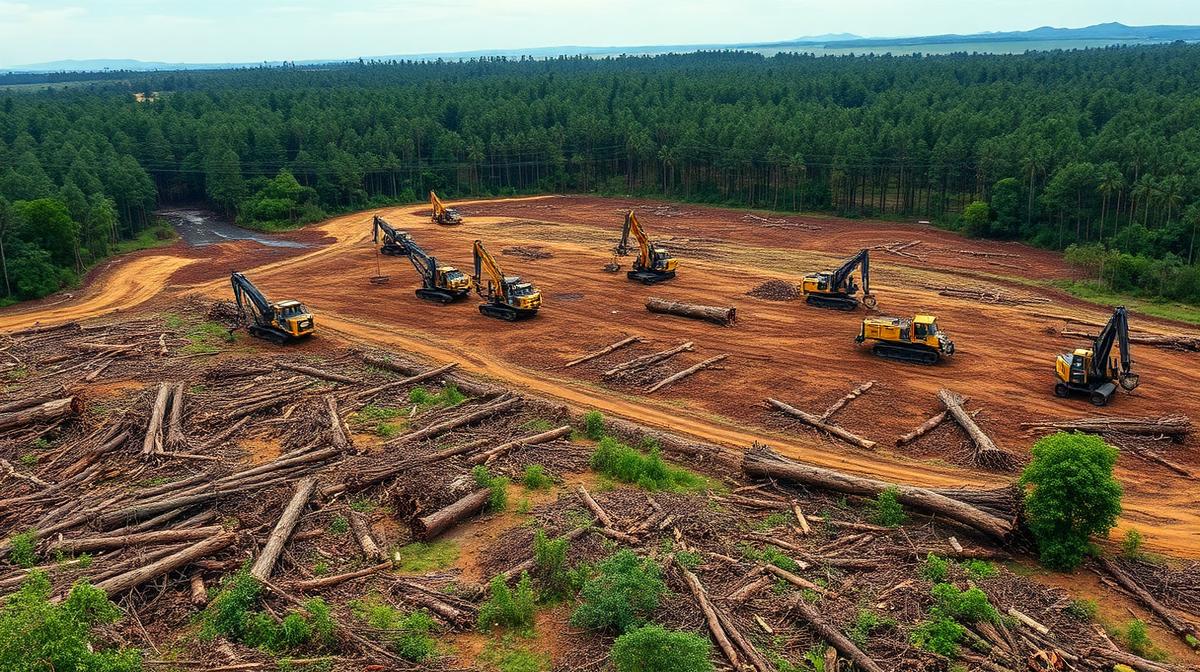
The annual figure encompasses commercial logging, agricultural clearing (the dominant driver), urban expansion, mining operations, and infrastructure development. Not all tree removal is visible or dramatic — much of it happens incrementally: a few hectares here for cattle ranching, a few more there for palm oil plantations, gradually erasing forest ecosystems that took centuries to develop.
What Drives 15 Billion Trees to Fall Each Year?
Agriculture is the primary culprit, responsible for approximately 73% of annual deforestation. Cattle ranching alone — overwhelmingly concentrated in Brazil — drives 40% of tropical forest loss. Soy, palm oil, and cocoa production account for another 18%. The connection between a steak on a plate in London and a falling tree in the Amazon is direct and quantifiable.
Commercial logging for timber and paper contributes about 15% of annual tree removal, though much of this occurs in managed forests where replanting is mandated. The remaining 12% includes urban sprawl, mining, and wildfires that, while natural, are intensifying due to climate change. In California and Australia, fire-driven tree loss has quadrupled in two decades.
The Replanting Gap
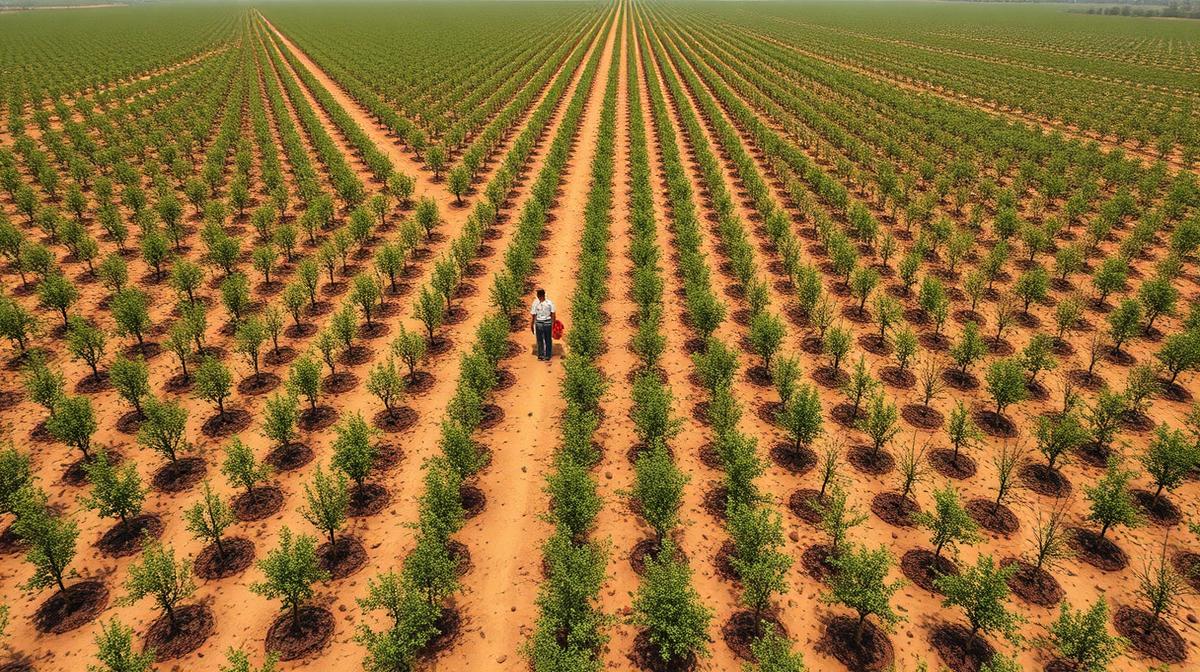
Globally, approximately 5 billion trees are planted each year through reforestation programs, commercial forestry rotations, and conservation initiatives. That sounds like a lot — until you compare it to the 15.3 billion being removed. The net deficit of 10.3 billion trees per year is the number that matters for Earth's carbon balance and biodiversity.
Even replanting statistics can be misleading. A newly planted sapling takes 20–50 years to reach the carbon absorption capacity of the mature tree it replaced. And monoculture plantations — rows of identical fast-growing species planted for harvest — provide a fraction of the biodiversity value of old-growth forests. Replacing an ancient Amazonian hardwood with a eucalyptus plantation is ecologically like replacing a cathedral with a parking garage.
Climate Impact of Annual Tree Loss
Trees are Earth's primary terrestrial carbon sink. A mature tree absorbs approximately 22 kilograms of CO₂ per year. The 15.3 billion trees removed annually would have absorbed 336 billion kg (336 million tonnes) of CO₂ per year if left standing. Worse, when trees are burned or decompose, they release their stored carbon back into the atmosphere — making deforestation a double blow.
The Intergovernmental Panel on Climate Change estimates that deforestation contributes 4.8 billion tonnes of CO₂ annually — roughly 12% of total anthropogenic emissions. This places land-use change as the third-largest emission source after energy and industry. Reducing annual tree loss is one of the most cost-effective climate interventions available, which is why it features prominently in the global CO₂ conversation.
Historical Context: Losing Half the World's Trees
Research published in Nature estimates that Earth held approximately 6 trillion trees at the dawn of human civilization. Today, roughly 3.04 trillion remain — a 46% reduction over 12,000 years. At the current net loss rate of 10.3 billion per year, we are removing what's left at an accelerating pace. The annual loss represents 0.34% of the remaining total — a seemingly small fraction that compounds devastatingly over decades.
Some regions have reversed the trend. China has increased its forest cover by 33% since 1990 through massive reforestation campaigns. Europe's forest area has grown by 9% in the same period. But these gains are dwarfed by losses in tropical regions, where the most biologically diverse and carbon-dense forests continue to fall at alarming rates.
Explore Related Environmental Data
Annual tree loss connects directly to the broader environmental picture. See the daily perspective of 42 million trees cut per day, or understand how the resulting carbon release contributes to 1,186 tonnes of CO₂ per second.
For a comprehensive view of planetary metrics tracked in real time, visit our environmental statistics dashboard, or explore everything happening in the world right now.