
Does Food Waste Include Peels and Bones? What the Numbers Count
Quick answer
Yes. UNEP’s food-waste total includes edible food and associated inedible parts, such as bones, shells and inedible peels. Its estimate of 1.05 billion tonnes for 2022 covers retail, food service and households—not losses before retail. Composting still counts as food waste; redistribution to people and diversion to animal feed do not.
About 33.3 tonnes per second · 2022 baseline
tonnes of food waste since you opened this article
Modelled estimate at About 33.3 tonnes per second · 2022 baseline. The visual total updates once per second.
Includes inedible parts at retail, food-service and household level. Modelled from an annual estimate, not a live measurement.
UNEP Food Waste Index 2024 · reference year 2022Food waste statistics usually count more than edible food. UNEP's Food Waste Index Report 2024 estimates that 1.05 billion tonnes of food were wasted in 2022 at retail, food-service and household level, and that figure explicitly includes inedible parts such as bones, shells and inedible peels. Under UNEP's method, scraps sent to composting or anaerobic digestion still count as waste; food redirected to animal feed or redistributed to people does not. So a food-waste total is not the same as the amount of food people could have eaten.
What counts as food waste?
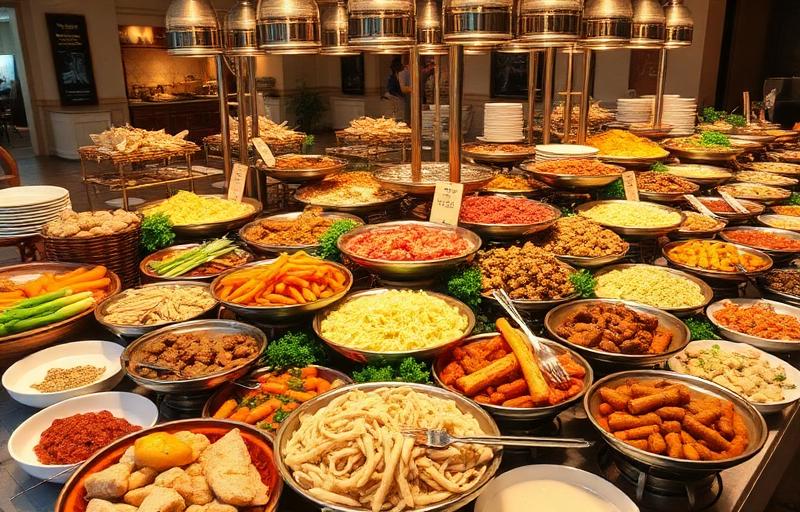
UNEP's Food Waste Index measures food, and the inedible parts attached to it, that leave the human food supply chain at three stages: retail, food service and households. It separates two components:
- Food (edible parts): anything intended for people to eat, including food that spoiled or was thrown away uneaten.
- Associated inedible parts: components not usually eaten, such as bones, eggshells, fruit stones and inedible peels.
The edible/inedible line is not universal. UNEP notes that what counts as "inedible" depends on culture and cuisine. For example, potato skins or fish heads are eaten in some kitchens and thrown away in others. Any study that splits the two needs to state how it classified them.
Do bones, peels and shells count?
Yes. All three are inside the headline numbers that most people quote:
| Statistic | Includes inedible parts? | Reference year |
|---|---|---|
| UNEP global food waste: 1.05 billion tonnes (retail + food service + households) | Yes | 2022 |
| Eurostat EU food waste: 59.2 million tonnes, 132 kg per person | Yes | 2022 |
| WRAP UK household food and drink waste: 6.0 million tonnes | Yes, reported separately | 2022 |
Because these totals include bones and peels, they should not be presented as "edible food that could have fed people." That needs an edible-only estimate, which few countries publish.
How much of household food waste is actually edible?
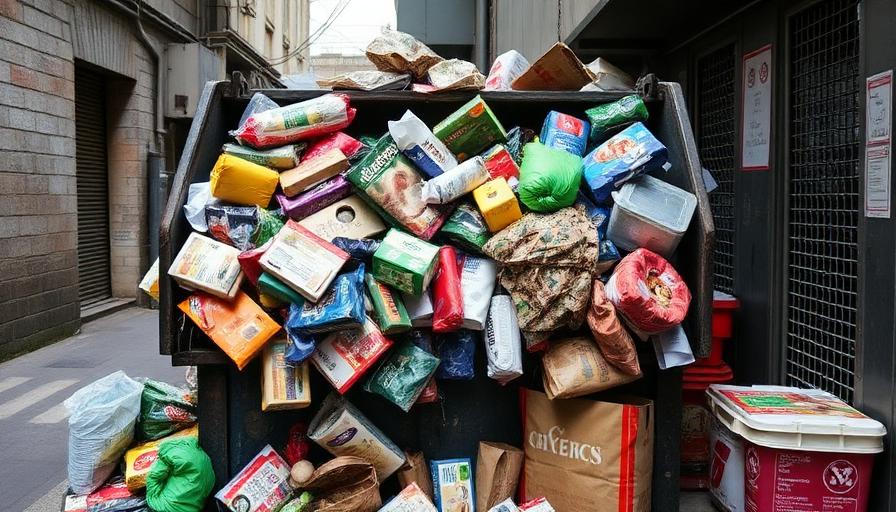
The best answer comes from countries that measure the split directly. The UK is one of the clearest examples. WRAP's Household Food and Drink Waste in the UK 2022 found:
- 6.0 million tonnes of food and drink wasted in UK homes in 2022, about 88 kg per person.
- 4.4 million tonnes (73%) were edible parts, such as bread, meat and the edible parts of fruit.
- 27% were parts generally considered inedible, such as eggshells, bones and inedible peel.
That 73/27 split is a UK household measurement. It should not be applied to the global total as if it were universal. Diets, cooking habits and the share of fresh produce versus processed food all change the ratio. It does show the order of magnitude: in a high-income country, roughly three-quarters of household food waste by weight was food that could have been eaten.
Where is food wasted?
UNEP's 2022 estimate splits the 1.05 billion tonnes like this:
| Stage | Tonnes (2022) | Share | Per person per year |
|---|---|---|---|
| Households | 631 million | 60% | 79 kg |
| Food service | 290 million | 28% | — |
| Retail | 131 million | 12% | — |
| Total | 1.05 billion | 100% | 132 kg |
UNEP describes this as almost one-fifth (19%) of all food available to consumers.
Calculated: 631 + 290 + 131 = 1,052 million tonnes, matching UNEP's rounded 1.05 billion. Divided evenly over a year, 1.05 billion tonnes is about 2.9 million tonnes per day (1.05 billion ÷ 365). That is an average from an annual estimate, not a daily measurement, and it covers only retail, food service and households, not losses on farms, in storage or in processing.
Does composting stop scraps from counting as food waste?
No. In UNEP's framework, food waste is defined by where material goes after leaving the food supply chain. Composting, anaerobic digestion, landfill, incineration, sewers and littering are all destinations of food waste. A peel in a compost bin is still food waste. Composting changes what happens to the material afterwards, not whether it was wasted.
Two destinations are treated differently. Food redistributed to people stays in the human food chain, and food sent to animal feed or used to make bio-based materials is counted as prevented waste rather than food waste. That is why a supermarket donating surplus bread and a household composting the same bread are recorded differently, even though neither went to landfill.
The practical lesson: composting is better than landfill for emissions, but it does not reduce food-waste statistics. Buying, storing and using food before it spoils does. The distinction between a collection destination and a final outcome also matters in plastic recycling statistics: collected material is not necessarily ultimately recycled.
Food waste vs food loss: why "one-third" and "19%" are both quoted
The widely repeated claim that "one-third of all food is lost or wasted" comes from a 2011 FAO study, Global Food Losses and Food Waste, which estimated about 1.3 billion tonnes per year using older methods and data. The UN has since replaced it with two separate indicators under Sustainable Development Goal 12.3:
- Food loss (FAO Food Loss Index): food lost after harvest up to, but not including, retail. FAO estimates about 13% of food produced is lost at this stage (13.2% in 2021).
- Food waste (UNEP Food Waste Index): retail, food service and households, about 19% of food available to consumers in 2022.
These two percentages use different denominators, production versus food available to consumers. They cannot simply be added to get a new "one-third." Neither covers losses on the farm before harvest. Anyone quoting one-third today is citing a 2011 estimate built on a different method.
Why it matters: emissions and hunger
UNEP reports that food loss and waste together generate an estimated 8–10% of global greenhouse-gas emissions, almost five times the emissions of the aviation sector. The same report notes this happens while 783 million people were affected by hunger. Inedible parts matter here too. Bones and peels sent to landfill still produce methane, which is why separate collection and composting reduce emissions even though the material still counts as waste.
How to read a food-waste number
Before quoting or comparing a food-waste figure, check:
- Edible only, or edible plus inedible? Most official totals include both.
- Which stages? Households only, consumer stages (retail, food service, households), or the whole chain including food loss?
- Which year? UNEP's global estimate is for 2022, published in 2024.
- Measured or modelled? UNEP's global figure combines measured national data with modelled estimates for countries without data. It is not a continuous weighing of all discarded food.
How this relates to the SnapCounters food-waste counter
The SnapCounters food-waste counter uses the same baseline as this article: UNEP's 1.05 billion tonnes for 2022, spread evenly as about 2.88 million tonnes per day. The scope is therefore identical: retail, food service and households, including inedible parts. The counter is a mathematical estimate derived from a sourced annual statistic, not a live measurement of food being thrown away, and it does not include FAO's separate food-loss estimate for the supply chain.
For the general method, see how live world counters work. Related estimates are on the environment counters hub. For another example of why a headline needs a precise definition, read water withdrawal vs. consumption. Just as food waste is not always edible food, water withdrawn is not always water consumed.
Sources and dates
- UNEP, Food Waste Index Report 2024 (published March 2024; reference year 2022).
- WRAP, Household Food and Drink Waste in the UK 2022 (reference year 2022).
- Eurostat, "Food waste: 132 kg per inhabitant in the EU in 2022" (reference year 2022).
- FAO, SDG indicator 12.3.1(a) Food Loss Index (reference year 2021).
- FAO, Global Food Losses and Food Waste (2011), cited only to explain the older "one-third" estimate.
All figures are the latest published by each source at the time of writing. They describe 2021–2022, not the current year.